![]()
목차
- [Spring Boot] - Actuator + Prometheus + Grafana
- Spring Boot - 메시지 국제화 MessageSource
- Spring Boot - WebMvcConfigurer
- Spring Boot - @SpringBootApplication 알아보기
참고
- https://docs.spring.io/spring-boot/docs/current/reference/htmlsingle/#actuator
- https://www.baeldung.com/spring-boot-actuators
- https://docs.spring.io/spring-boot/docs/2.1.8.RELEASE/reference/html/production-ready.html
- https://covenant.tistory.com/244
- https://devbksheen.tistory.com/182
✅ Spring Actuator
Spring Actuator 는 별도의 구현 없이 애플리케이션의 Metric 정보, 트래픽 정보, 데이터 베이스 등 운영환경에서 실행중인 애플리케이션의 상태 정보에 접근 할 수 있는 기능을 제공하고, HTTP 와 JMX 를 이용해 접근할 수 있다.
공식 문서 에서 Actuator 가 지원하는 다양한 EndPoint 를 확인할 수 있다.
Actuator 라이브러리 추가
implementation 'org.springframework.boot:spring-boot-starter-actuator' |
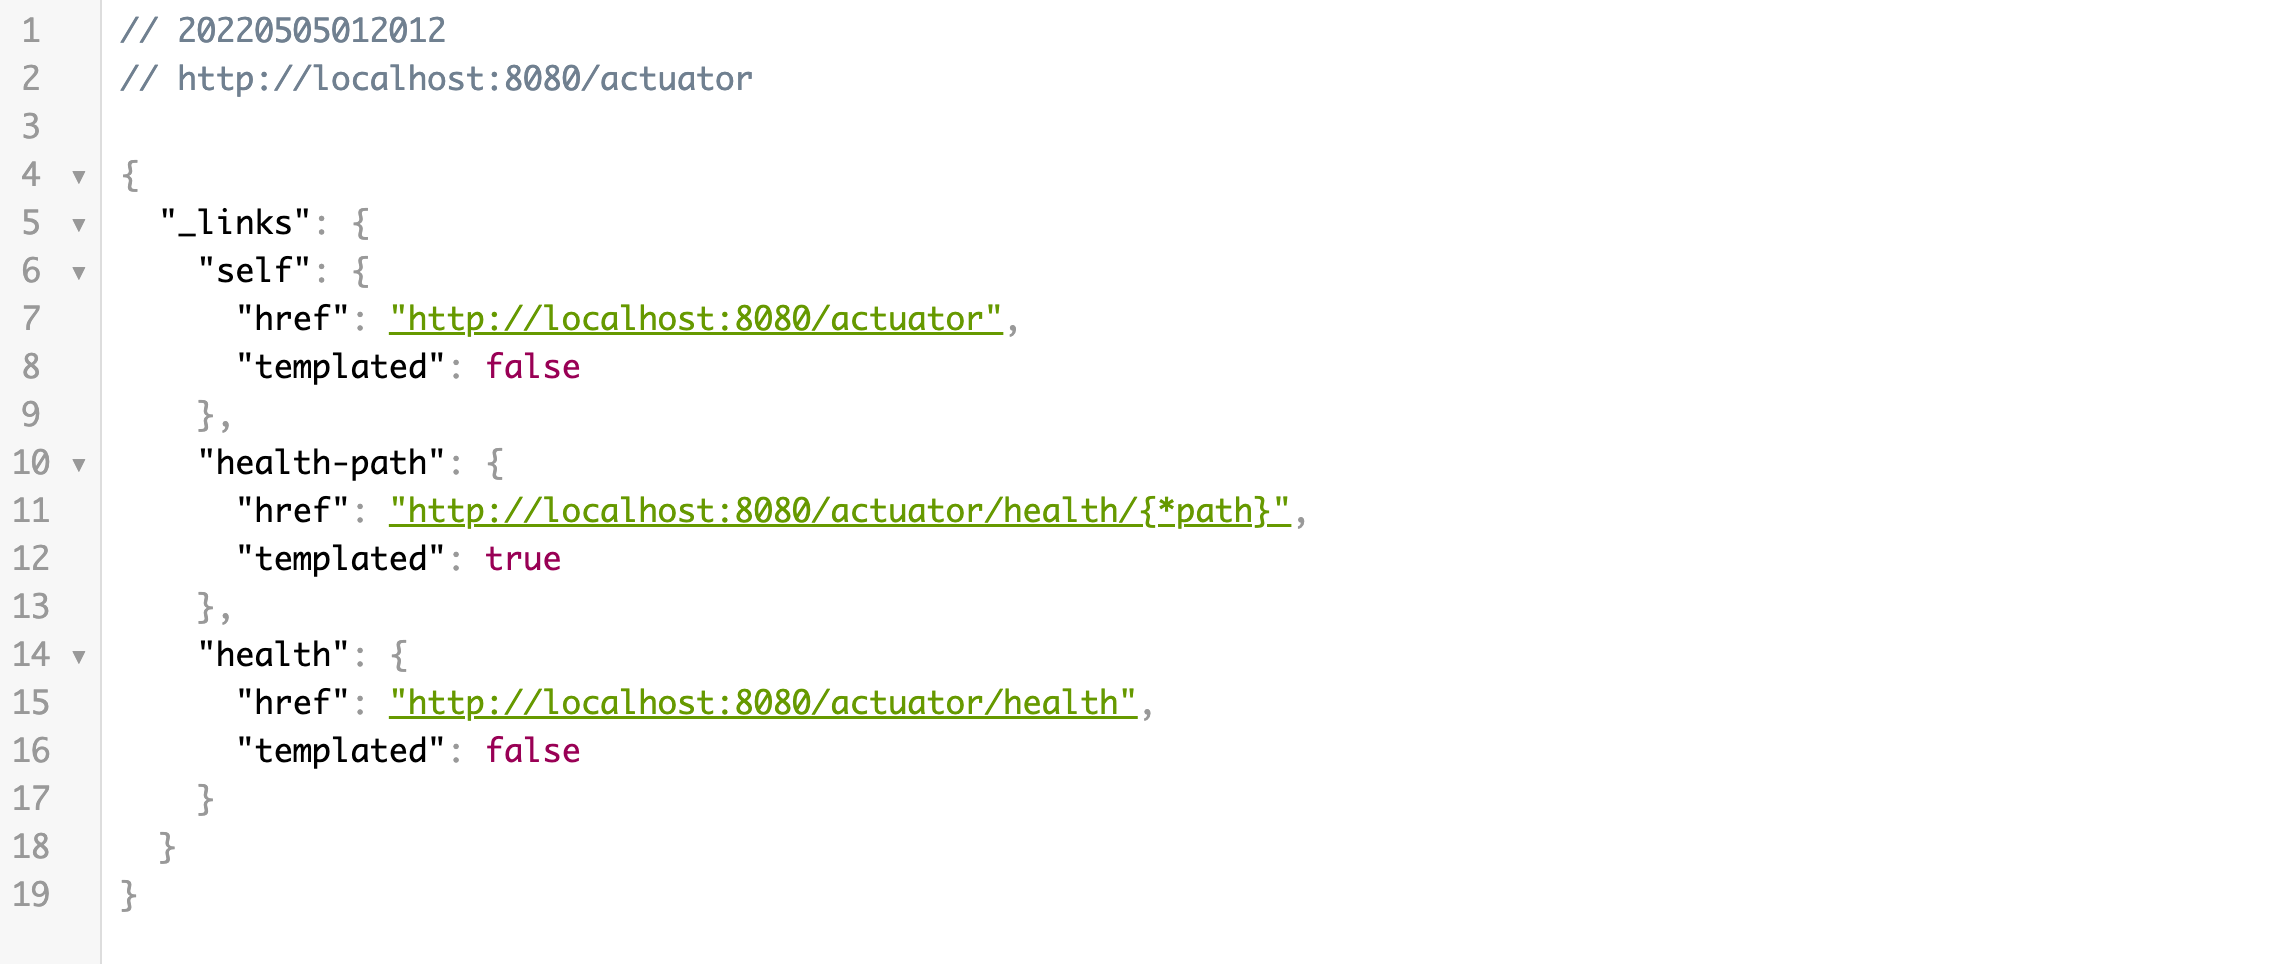
의존성을 추가한 뒤 Spring Application 을 실행 시킨 후 http://localhost:8080/actuator 로 접속하면 현재 Application 에서 EndPoint 들을 확인할 수 있다.
✅ Spring Actuator 와 Prometheus 연동설정
보통 Spring Actuator 를 사용하게 되면 메트릭을 수집할 수 있는 메트릭 수집기와 수집된 메트릭을 사용자에게 보여주기 위한 대시보드를 함께 구축합니다.
저는 무료로 그리고 일반적으로 많이 사용하는 메트릭 수집기인 프로메테우스를 이용하려고 합니다.
라이브러리 추가
implementation 'io.micrometer:micrometer-core' |
Spring boot 설정
Prometheus 의 경우 메트릭을 Pull 방식으로 수집하기 때문에 Prometheus 가 접근할 수 있는 EndPoint 가 필요합니다. Spring Application 에 접근해 정보를 읽어갈 수 있도록 설정을 추가해줍니다.
management: |
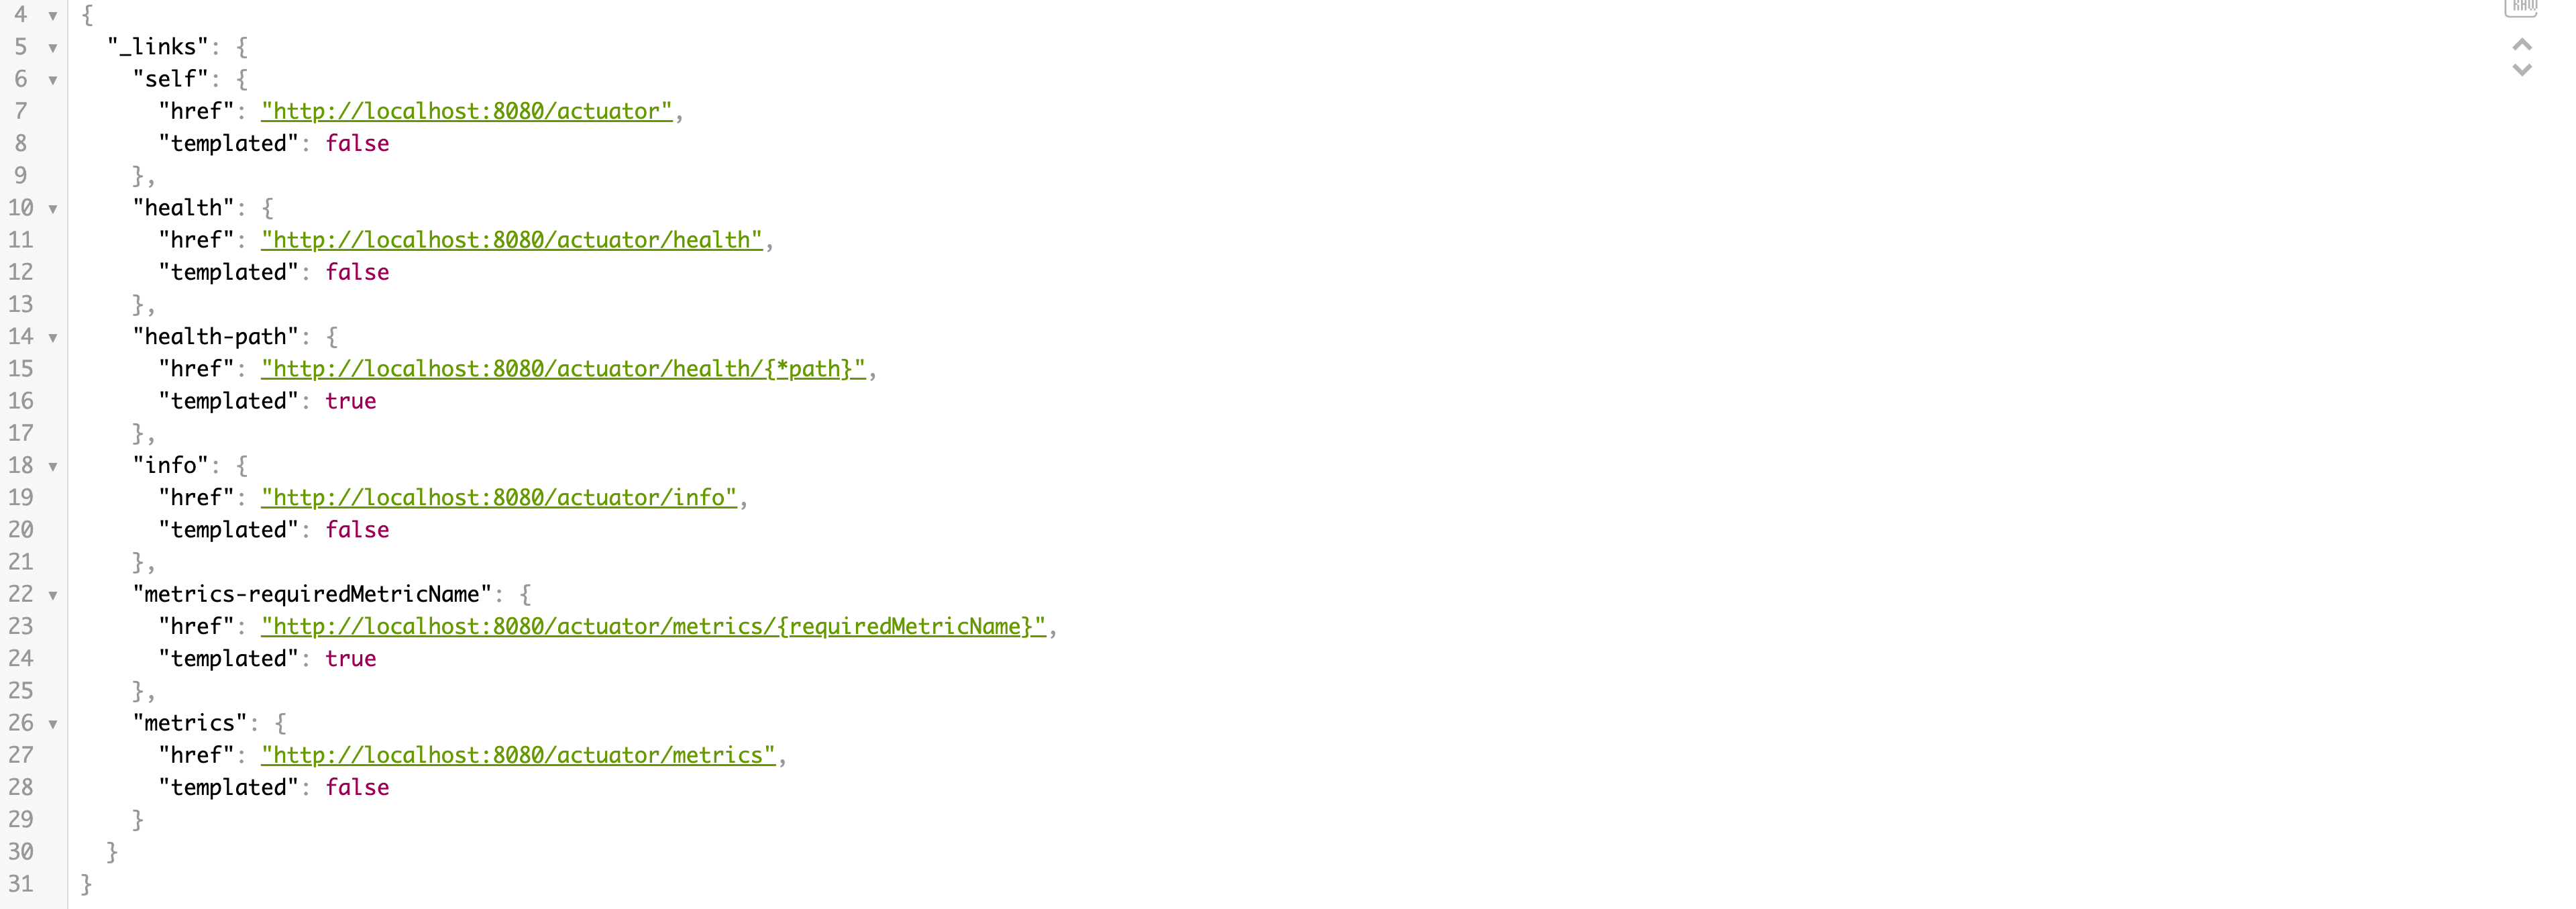
Prometheus 와 Metric 정보를 위한 EndPoint 들이 개방된 것을 확인할 수 있다.
✅ Prometheus 설정 및 실행
Prometheus 직접 설치해서 세팅하는 방법도 있지만, 저는 Docker 를 이용해 시스템을 구축하려 합니다. Prometheus 가 실행될 때 Spring Applciation 이 제공하는 정보를 읽어가기 위해서 prometheus.yml 파일을 생성 및 필요한 정보를 기입합니다.
prometheus.yml 생성
prometheus.yml 에는 Prometheus 가 메트릭을 수집하는 주기와 메트릭을 수집할 애플리케이션 서버 정보들을 기입해줍니다.
그외 prometheus.yml 에 추가하고 싶은 설정 내용은 공식문서 에서 확인할 수 있습니다.
global: |
Docker 를 이용한 Prometheus 실행
docker 를 이용해 Prometheus 이미지 를 띄어줍니다. 이미지를 실행 시킬 때 Local 에 설정한 prometheus.yml 파일과 이미지 내부 파일을 연결해 docker 내부에서 설정을 사용할 수 있도록 한다.
docker run -d -p 9090:9090 --name prometheus \ |
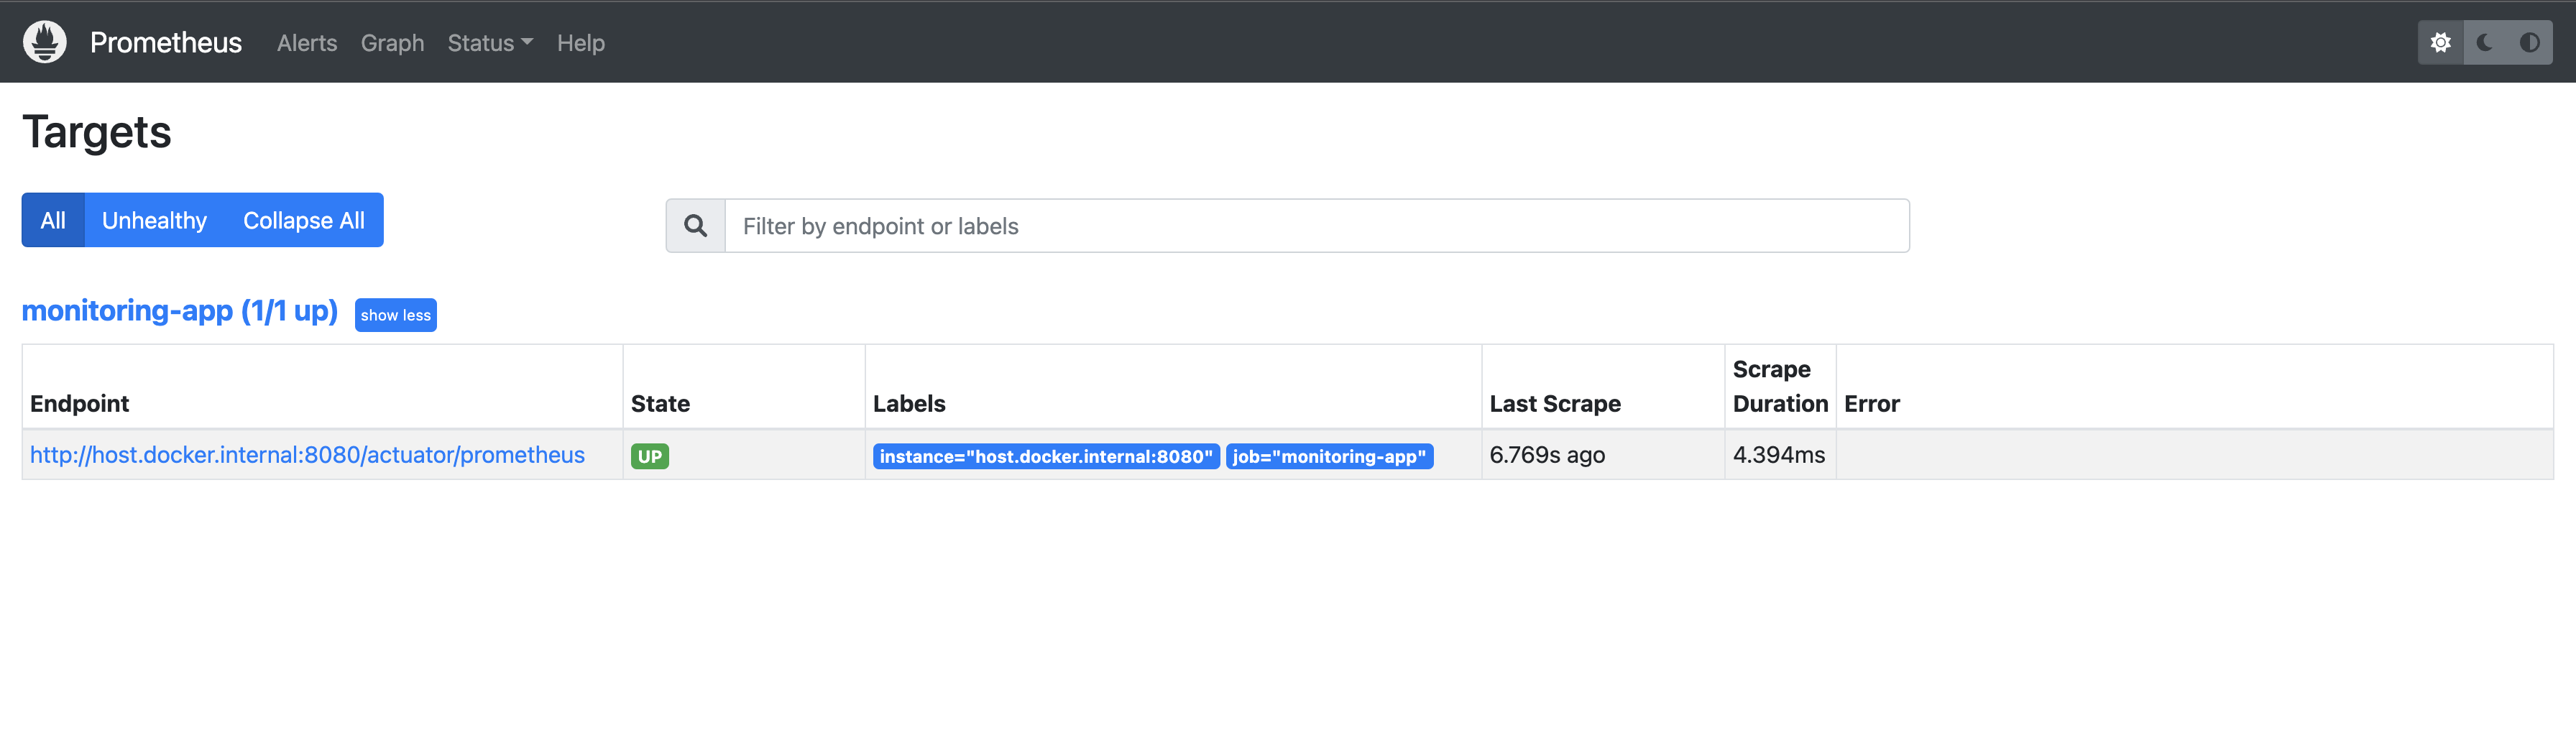
http://localhost:9090/ 에 접속 하면 Target 에 Spring Application 이 잡혀있는 것을 확인할 수 있다.
✅ Grafana 설정
Grafana 도 docker 이미지를 사용해 Prometheus 가 읽어온 데이터를 시각화 하도록 설정한다.
docker run --name grafana -d -p 3000:3000 grafana/grafana |
http://localhost:3000/ 에 접속하면 현재 실행중인 Grafana 에 접속 할 수 있습니다. 초기 ID/PW 는 admin/admin 입니다.
Grafana Data sources 추가
Grafana 에서 메트릭 정보를 시각화 하기 위해서는 데이터 소스가 필요합니다. 우리는 프로메테우스를 이용해 메트릭을 수집하므로 Data sources 를 클릭해 Prometheus 를 추가해줍니다.
URL 에는 현재 실행중인 Prometheus URL 정보를 기입해줍니다.
Grafana Dashboard 추가
Grafana 에서는 메트릭 정보를 시각화 하기 위해 Dashboard 를 생성하거나 유명한 Dashboard 를 가져올 수 있습니다.
Import 를 클랙해 JVM dashboard 를 가져오도록 한다.(https://grafana.com/grafana/dashboards/4701)
Prometheus 로 부터 Metric 정보를 읽어와 그래프 형태로 데이터를 보여주는 것을 확인할 수 있다.